Understanding the world of investing can sometimes feel like deciphering a new language. Amidst all the numbers and jargon, one term that frequently pops up is the Price-to-Book (P/B) ratio. It’s a handy metric that helps investors size up the value of a company by comparing its market value to its book value. But what exactly does this entail, and why does it matter? Let’s break it down in the most straightforward way possible.
First things first, the P/B ratio is essentially a relationship between what’s known as the “book value” of a company and its current market price. Book value is the net value of a company’s assets, or, more plainly, the value remaining if a company sold everything it owned and paid off all its debts. It’s kind of like figuring out how much cash you’d have left after selling your car and settling any auto loans.
Calculating the P/B ratio doesn’t require a PhD in mathematics—it’s actually quite a simple process. Picture this approach: grab a company’s current stock price, then dig through its balance sheet to gauge the total assets and liabilities. Subtract liabilities from assets to get the book value, then divide this by the total number of shares. Finally, take that market price and divide it by your newly calculated book value per share. Voilà, you have your P/B ratio.
Here’s a quick example to bring it to life: imagine Company X with $3 billion in assets, $2 billion in liabilities, 100 million shares circulating out there, and each share priced at $15. After running through the numbers (subtract liabilities from assets), you get a book value of $1 billion. Dividing by the number of shares lands you at $10 per share. With a market price of $15, the P/B ratio stands at 1.5. Not rocket science, right?
Why does this ratio earn a gold star in the toolbox of investment metrics? It helps spotlight stocks that might be undervalued. A P/B ratio under 1 suggests a stock is trading for less than its book value—imagine buying a designer handbag on sale for half the price. Sounds like a steal, right? It’s also a neat way to put similar companies under the microscope, helping decide which one offers a better bang for your buck.
Moreover, for companies with unpredictable earnings, the P/B ratio serves as a more stable guide than other metrics, like the price-to-earnings ratio. Think of it like having a compass when GPS signals are spotty—it offers a clearer direction in murky waters.
However, no compass is flawless. There are quirks to keep in mind when using the P/B ratio. For instance, tech companies heavily laden with intangible assets (like patents or goodwill) often have high P/B ratios. This is because these intangible assets might not show up prominently on balance sheets, throwing off the math. The ratio also varies wildly across different sectors—a great P/B for retail might not hold the same weight in aerospace. So, it’s crucial to stack companies up against their peers, not against an unrelated sector.
And let’s not forget about using the ratio alongside other metrics. Much like baking, where one ingredient alone doesn’t make a cake, a single financial metric doesn’t paint the full picture of a company’s value.
To bring this into the real world, imagine deciding between Bank of America, sporting a P/B ratio of 0.8, and JP Morgan Chase at 1.2. On the surface, Bank of America appears a better deal; however, if JP Morgan Chase boasts consistently higher profits, that extra expense might just be worth it. It’s like choosing between a budget airline ticket and an all-inclusive first-class experience.
Incorporating the P/B ratio into your investment strategy can be a game-changer. It’s a staple in value investing—where the hunt is on for undervalued assets that have the potential to rocket in value down the line. Inputting this ratio into decision-making might also help spot companies with solid long-term potential that others might have overlooked.
Of course, a low P/B ratio could sometimes ring alarm bells, hinting at underlying issues within a company. Like finding an insanely discounted product that seems too good to be true, due diligence is essential to ensure the investment is as promising as it appears.
When diving into the investing seas armed with the P/B ratio, a few life hacks can make the journey smoother. Stay updated with the latest financial statements of potential investment targets, allowing you to refine your strategy based on the freshest data. Diversification is another golden rule to bear in mind—it’s the financial equivalent of not putting all your eggs in one basket. This way, even if one investment flounders, others provide a safety net.
Moreover, if numbers and financial sheets feel daunting, leaning on experts can be incredibly helpful. Financial advisors can offer guidance, ensuring that you’re wielding the P/B ratio optimally.
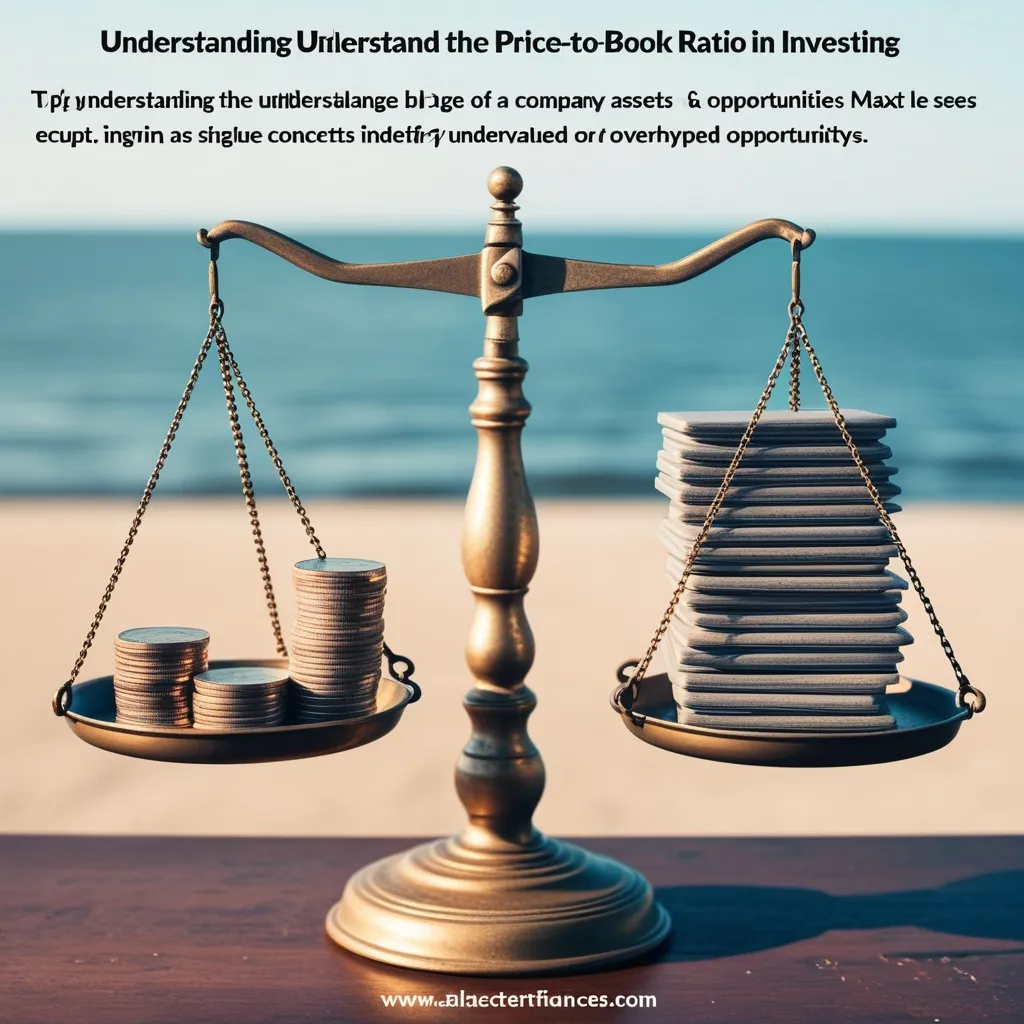
To wrap up, the Price-to-Book ratio is a tool that can significantly aid investors in gauging a company’s value. While it works best when paired with other metrics and adjusted for industry norms, it’s nonetheless a robust metric for identifying whether a stock is underpriced or overhyped. With the right mix of tools and strategies, the P/B ratio can be your trusty sidekick in navigating the intricate world of investments, providing clarity and insight along the way.
Ultimately, solid investing boils down to crunching data to make informed choices. The P/B ratio simplifies this task, distilling complex valuation into a digestible form. Next time an enticing investment prospect catches your eye, put the P/B ratio to the test—it might just tip the scales in your favor, steering you toward a smart financial decision.