Imagine stepping into a room where the true value of a company materializes as a living, breathing 3D model. This isn’t about poring over financial statements or crunching numbers; it’s about transforming complex data into an immersive, spatial experience. With advanced holographic technology, you can walk through a company’s assets, liabilities, and potential, all represented as tangible objects.
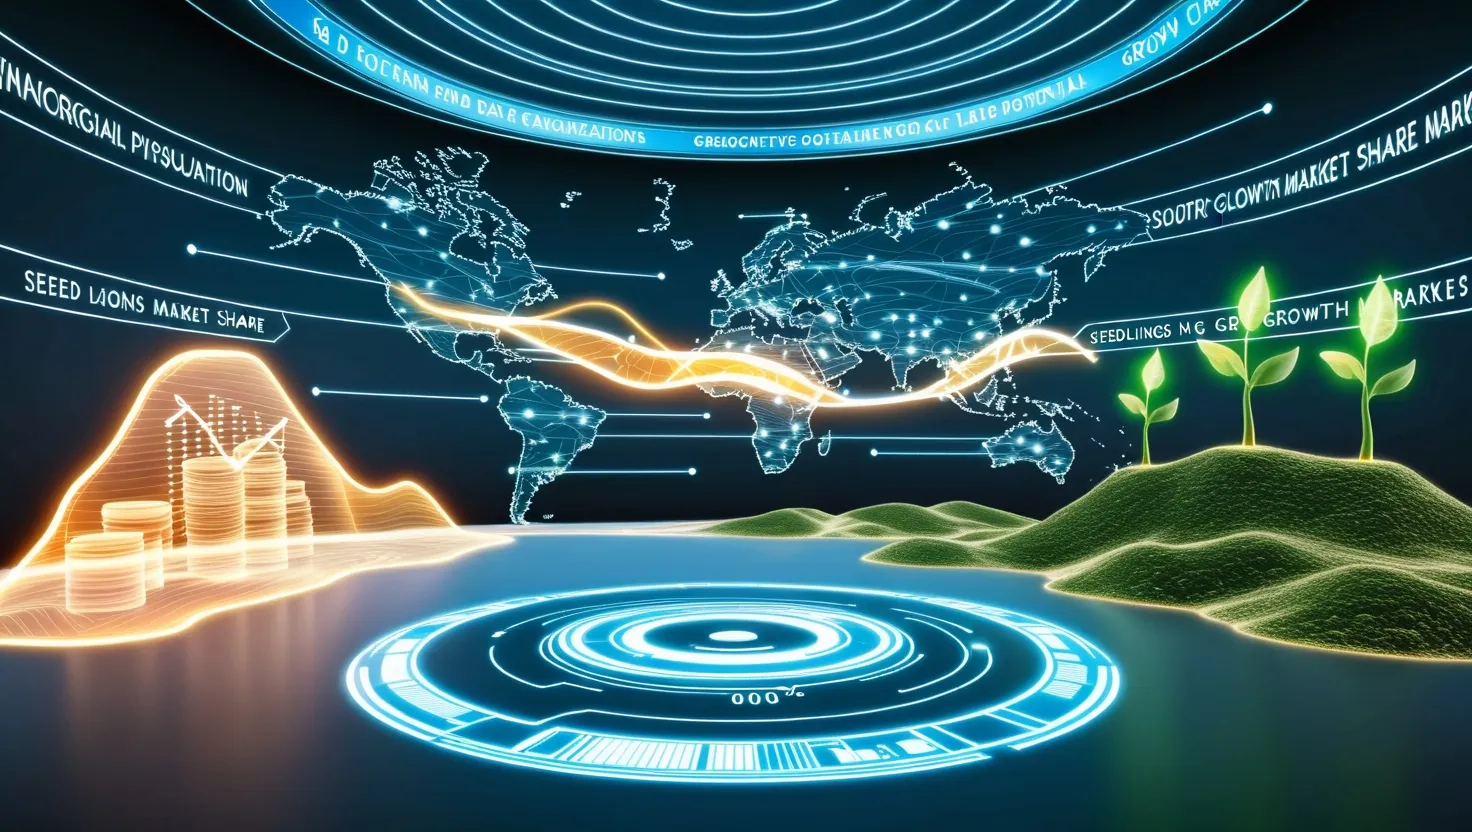
Picture this: you enter a spacious room, and before you lies a holographic landscape that represents the financial health and future prospects of a company. Cash flows are depicted as flowing rivers, market share as expansive territories, and growth potential as seeds waiting to sprout. This 3D visualization is not just a novelty; it’s a powerful tool that turns value investing into a visceral, explorative journey.
As you navigate this holographic world, your spatial reasoning and intuition work in harmony with hard data to uncover hidden gems and avoid costly pitfalls. You might notice a small product line, represented by a tiny sapling, perfectly positioned to explode into a forest of profit. Or, you could spot a hidden debt burden, lurking as a shadowy mass beneath an otherwise healthy-looking structure. This kind of insight is impossible to gain from spreadsheets alone.
The Power of Holographic Visualization
Holographic technology has advanced significantly in recent years, allowing for real-time 3D hologram generation that was previously thought to be impossible with consumer-grade hardware. Researchers have developed methods like tensor holography, which use deep learning to accelerate computer-generated holography. This means that complex data can now be rendered into photorealistic holograms almost instantly, even on a laptop[4].
Companies like Holoxica are already leveraging this technology to create holographic 3D terrain visualizations. Their HoloMaps app allows users to build and explore 3D maps from anywhere on the globe, complete with layers such as height contours, infrastructure, and labelled satellite data. This kind of visualization is not limited to geographical data; it can be applied to any complex dataset, including financial information[3].
Bringing Financial Data to Life
When financial data is visualized in 3D, it becomes more intuitive and accessible. Imagine walking through a holographic representation of a company’s balance sheet. Assets could be depicted as solid structures, while liabilities might appear as translucent clouds hovering above. Equity could be represented as a foundation, supporting the entire structure.
Cash flows, those rivers mentioned earlier, could be colored based on their health – green for positive cash flows and red for negative ones. This visual cue immediately highlights areas of financial strength and weakness. Market share could be shown as territories on a map, with the size and color of each territory indicating the company’s dominance in different markets.
Interactive Insights
One of the most powerful aspects of holographic value mapping is its interactivity. You can manipulate the 3D model in real-time, asking questions and getting immediate visual answers. For instance, you might want to see how a potential acquisition would impact the company’s financial structure. By adding a new element to the hologram, you can instantly visualize the effects on cash flows, market share, and overall financial health.
This interactivity is not just about adding or removing elements; it’s also about exploring different scenarios. You could simulate various market conditions or economic scenarios to see how the company would fare. This kind of dynamic analysis is far more engaging and insightful than static financial models.
Real-World Applications
The applications of holographic value mapping extend beyond just financial analysis. In fields like urban planning, holographic 3D models can help visualize and manage complex infrastructure projects. For example, a city’s transportation system could be represented as a network of holographic roads and public transit lines, allowing planners to see the impact of new developments or changes in traffic patterns.
In healthcare, holographic models can be used to visualize patient data, such as 3D representations of organs or tumors. This can help doctors and patients better understand complex medical conditions and make more informed decisions[5].
Overcoming Traditional Limitations
Traditional methods of data visualization, such as spreadsheets and 2D graphs, have several limitations. They can be overwhelming, especially when dealing with large datasets. Holographic visualization, on the other hand, leverages our natural ability to understand spatial relationships, making complex data more digestible.
Moreover, holographic models can correct for visual aberrations, providing a sharper and more comfortable viewing experience. This is particularly important for applications where users need to spend extended periods analyzing data, such as in financial analysis or medical diagnostics[4].
The Future of Data Visualization
As holographic technology continues to evolve, we can expect to see even more sophisticated applications in various fields. Companies like IKIN are pioneering new visual technologies that utilize AI-driven head tracking to render realistic dimensional perspectives. Their holographic projectors and displays are designed to work in ambient light, without the need for special headgear, making them more accessible and user-friendly[5].
The future of data visualization is not just about creating pretty pictures; it’s about enhancing our ability to understand and interact with complex information. By transforming data into immersive, spatial experiences, we can gain deeper insights and make more informed decisions.
Practical Steps to Implement Holographic Value Mapping
Implementing holographic value mapping is more feasible than you might think. Here are some practical steps to get started:
-
Choose the Right Technology: Look for platforms that support 3D visualization and holographic rendering. Tools like the Ada Platform, which integrates with Global Mapper, can help you create detailed 3D models from various types of data[1].
-
Prepare Your Data: Ensure your financial data is organized and ready for visualization. This might involve cleaning and formatting your data to be compatible with holographic software.
-
Select a Display Method: Decide how you will display your hologram. Options range from Microsoft HoloLens headsets to Looking Glass light field displays or even holographic projectors like IKIN’s ARC[3][5].
-
Train and Practice: Once you have the technology and data in place, spend time learning how to use the software and interpreting the holographic models. Practice makes perfect, and the more you interact with these models, the more insights you will gain.
In conclusion, holographic value mapping is a revolutionary approach to understanding complex financial data. By transforming numbers into tangible, interactive objects, you can gain a deeper, more intuitive understanding of a company’s true value. This technology is not just a tool for financial analysts; it’s a game-changer for anyone looking to make informed decisions based on complex data. As you step into this holographic world, you’re not just analyzing numbers – you’re exploring the very fabric of a company’s financial health.