Heat mapping is like having a superpower that lets you peek into the highs and lows of performance throughout the day. This nifty tool is making waves in fields like energy management, user behavior analysis, and performance monitoring. Let’s geek out on how heat maps can uncover hidden gems of information and help us get better at, well, pretty much everything.
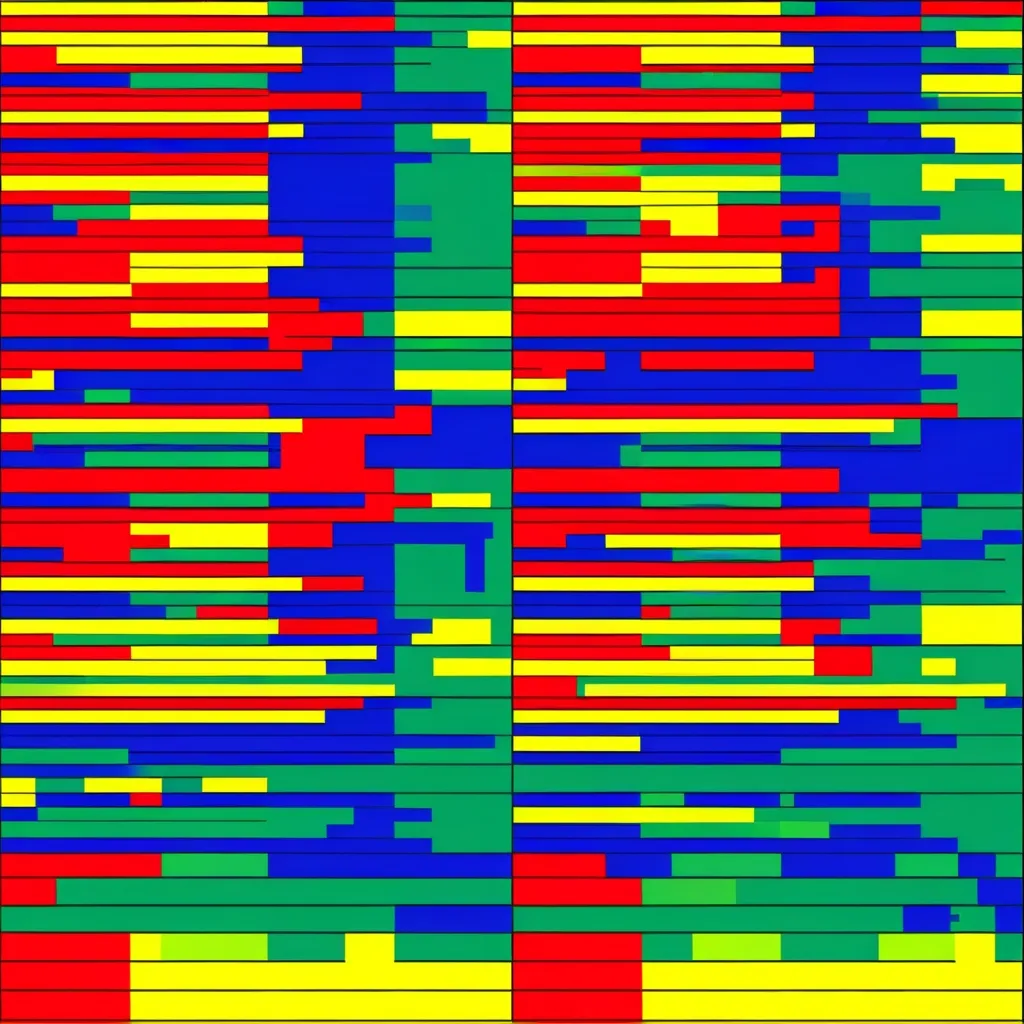
Imagine you’ve got a colorful calendar laid out in front of you. Each day, a block of color shows up, representing energy usage. Bright reds might mean high energy consumption, while cool blues could show low usage. Seeing these patterns can instantly tell you which days are energy hogs and which are chill. In a high school, you might see lots of green on weekends and holidays, thanks to lights and ACs taking a break. But a university lab might light up like a Christmas tree daily, especially in the summer when air conditioning is cranking up.
Spotting these trends not only helps in catching scheduling hiccups but also in managing peak demand issues. Let’s say your heat map shows weirdly high energy usage on Saturdays, but your school’s supposed to be empty. That’s a red flag for a possible scheduling error. And if you’re comparing different buildings, you can easily spot which one’s the energy guzzler and prioritize fixing it up first.
Heat maps shine in revealing trends and outliers in massive datasets. They use colors to make numbers come alive, making it a breeze to spot patterns. This is gold in places like network operations centers or financial trading floors. Quick visual feedback helps in identifying bottlenecks or issues demanding immediate attention. In a factory, for example, a heat map might show you where production consistently drags, screaming out for process improvements.
In the realm of digital marketing, heat maps are your BFF for analyzing user behavior on websites and apps. They show where users are clicking, scrolling, or just staring. This is key for tweaking user interfaces and making the experience better. You might find out that users stop scrolling halfway through a page or that a specific button is getting ignored. Armed with this info, you can re-do layouts, images, and buttons to get users engaged and converting.
Heat maps make complex data easy on the eyes. Instead of drowning in tables and reports, you get a visual story at a glance. This helps in grasping relationships and trends that might slip through the cracks in traditional data representation. Imagine a healthcare setup using heat maps to plot patient arrival patterns against staffing schedules. Spotting times of under or overstaffing becomes super easy, leading to a more balanced and efficient staffing model.
These visual wonders aren’t limited to one or two industries; they’re everywhere. From marketing and finance to healthcare and logistics, heat maps can be tailored to highlight different slices of a dataset—whether it’s about geography, time, or individual performance metrics. In finance, they can give real-time peeks into market trends. In logistics, they can fine-tune supply chain operations by visualizing data on shipment routes and delivery times.
Let’s get into some practical uses of heat maps. Say a company uses a yearly calendar heat map to see its energy usage. Spotting high-energy days, they might tweak HVAC schedules or adjust lighting during peak hours to save on bills. For website owners, a heat map can reveal user hotspots. If a popular page isn’t converting well, that’s a sign it needs some layout love or a better call-to-action. Hospitals could map patient arrivals and align staff schedules for smoother operations and reduced wait times.
One thing to note when playing with heat maps is the color scale. Colors are relative to the data, so green doesn’t always mean good, and red doesn’t always scream bad. Always check the context and magnitude of the readings. If you’re comparing energy use between two buildings, a fixed color scale can help show absolute differences. But for relative comparisons, metrics like energy use per square foot might be more insightful.
Heat maps are the unsung heroes of identifying peak performance times and optimizing nearly anything you set your mind to. By visualizing data in a clear and engaging way, they help spot trends, anomalies, and areas needing a boost. Whether it’s managing energy, understanding user behavior, or balancing staff schedules, heat maps provide the eye-opening insights needed to make smarter decisions and achieve better outcomes.