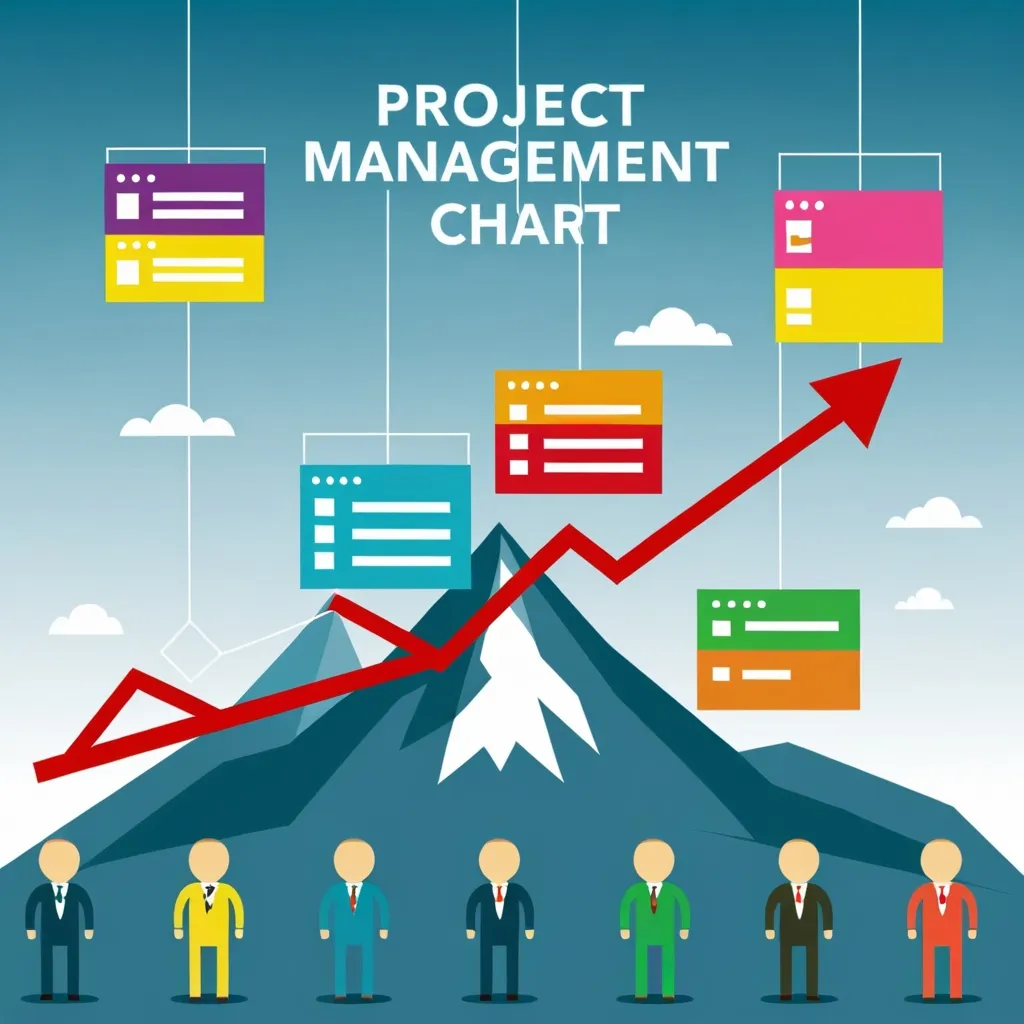
The Task Burndown Method: A Game-Changer for Project Management
Managing projects can be a real headache, right? But what if I told you there’s a way to make it a whole lot easier? Enter the task burndown method. It’s like having a magic crystal ball that shows you exactly where your project stands and where it’s headed. Pretty cool, huh?
Let’s dive into why this method is such a big deal. First off, it’s all about clarity. You know how sometimes you’re working on a project and you’re not quite sure if you’re on track? Well, with a burndown chart, that confusion goes right out the window. It’s like having a GPS for your project, showing you the route and how far you’ve come.
Picture this: you’ve got a chart that shows the work left to do on one side and the time you’ve got on the other. As you tick off tasks, you can literally see the line on the chart dropping. It’s weirdly satisfying, trust me. And if that line isn’t dropping as fast as it should? Well, that’s your cue to figure out what’s holding things up.
But it’s not just about keeping track of stuff. This method is a real morale booster too. There’s something about seeing progress that just gets people fired up. It’s like watching your fitness tracker and seeing those steps add up - it makes you want to do more, right?
Now, here’s a pro tip: break those tasks down into bite-sized chunks. We’re talking tasks that take a day, tops. Why? Because it makes the whole thing way more accurate. Think about it - if you’ve got a task that takes a week, it looks like you’re not making progress for ages, then suddenly, bam! A big chunk of work is done. But with smaller tasks, you get a smoother, more realistic picture.
Here’s the thing though - it’s not just about ticking boxes. You’ve got to keep your eye on the prize. Finishing 90 out of 100 tasks sounds great, but if those 90 don’t actually complete any major part of the project, you’re not really as far along as you think. That’s why some smart cookies use two charts - one for tasks and one for bigger project chunks or ‘stories’.
Now, let’s talk about some common oopsies people make with this method. Sometimes folks lump a bunch of stories together because they share a function. Bad move. It makes it look like you’ve got way more work than you actually do. Or they make tasks that are way too big or way too detailed. Neither is good. You want that Goldilocks zone - just right.
The beauty of burndown charts is that they’re not set in stone. They’re more like a living, breathing thing that changes as your project does. Added some extra work? Your chart will show it. Hit a snag that’s slowing you down? Yep, you’ll see that too. It’s all about being able to roll with the punches and adjust on the fly.
And here’s a little secret - burndown charts play really well with other project management tools. It’s like they’re the bass line in your project management band, keeping everything in rhythm. Pair it with a well-managed product backlog and a solid change control process, and you’re cooking with gas.
So, how do you actually make one of these charts? It’s easier than you might think. First, you figure out how much work you’ve got to do. Let’s say you’ve got a two-week sprint with 80 hours of work. Plot that on your chart. Then, break that work down into those small tasks we talked about earlier. As you go along, track how long each task actually takes. This is where the magic happens - you can see if you’re staying on track or if you need to pick up the pace.
Let me paint you a picture. You’re working on a new app feature with a team of five developers. You reckon it’ll take about 420 hours all up. Your chart shows you should be knocking off about 30 hours of work each day to hit your target. Three days in, you check your chart and - uh oh - you’re falling behind. Time for a team huddle to figure out what’s going on and how to catch up.
The task burndown method isn’t just some fancy chart - it’s a whole new way of looking at your projects. It keeps everyone on the same page, motivated, and focused on what really matters. Whether you’re coding the next big app or planning a killer marketing campaign, this method can help you get there faster and smoother.
So next time you’re staring down the barrel of a big project, give the task burndown method a shot. It might just be the secret weapon you’ve been looking for to knock your projects out of the park. Trust me, your future self will thank you for it.


