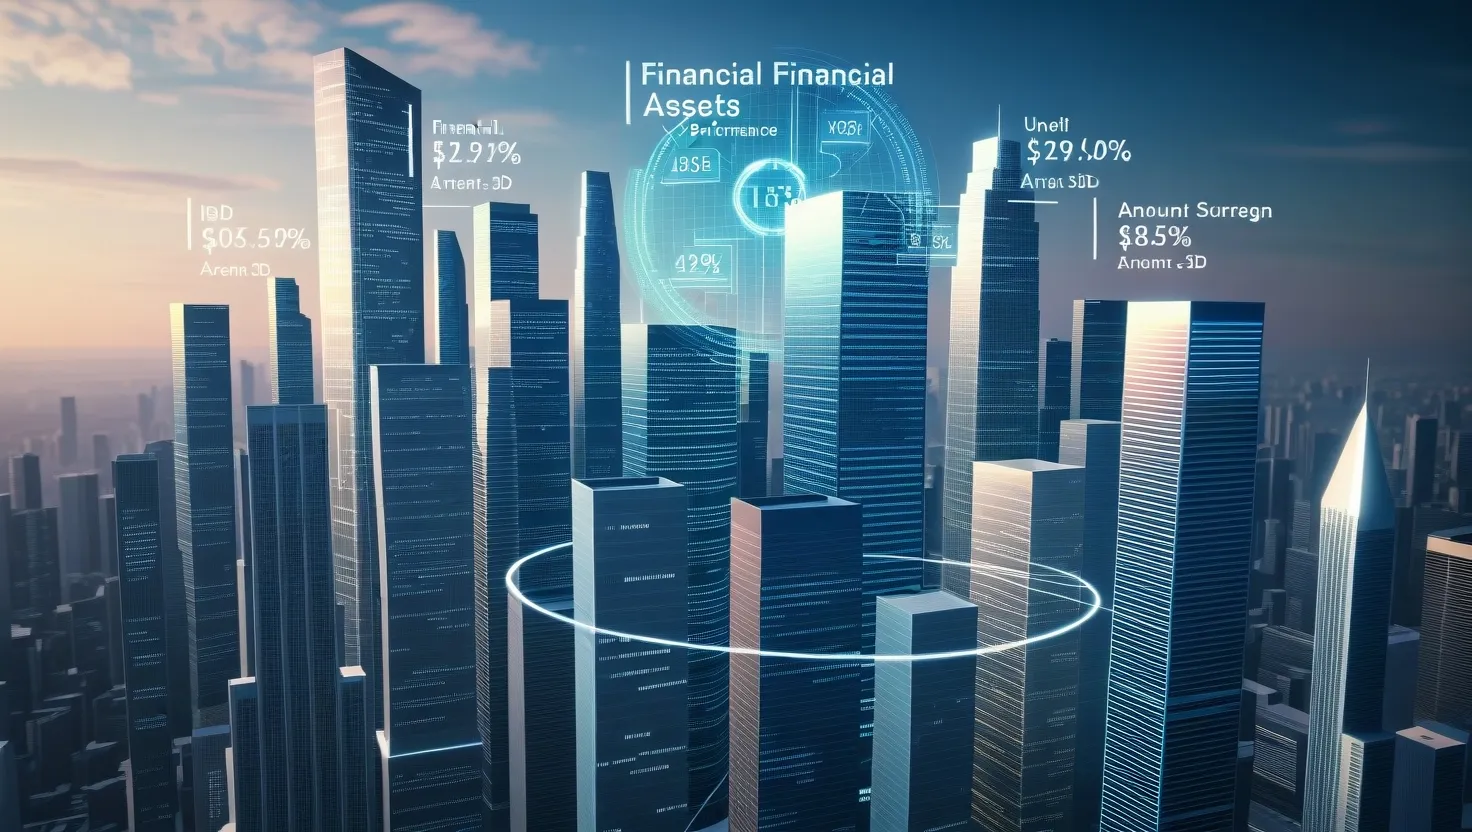
Imagine stepping into a room where your investment portfolio transforms into a vibrant, three-dimensional cityscape. This isn’t about staring at pie charts or scrolling through spreadsheets; it’s about bringing your financial data to life in a way that’s both immersive and interactive. With the advent of holographic technology, you can now walk through your investments as if you’re navigating a bustling metropolis.
Each building in this financial city represents a different asset. The height of the building indicates its value, while its color reflects its performance. Stable bonds might be depicted as sturdy skyscrapers, standing tall and unwavering, while volatile stocks could be represented by shape-shifting structures that fluctuate in size and color. This visual representation makes it easier to understand the dynamics of your portfolio at a glance.
As you explore this 3D city, you can zoom in on individual buildings to get a closer look at your specific holdings. Real-time data flows through these structures like traffic, giving you an immediate sense of how each asset is performing. For instance, if a stock is doing well, its building might glow with a bright, pulsing light, while a struggling asset might appear dim and stagnant. This real-time feedback allows you to make informed decisions quickly.
Zooming out, you can see how different sectors of your portfolio interact, much like observing the relationships between various city districts. This holistic view helps you identify trends and patterns that might be harder to spot on a traditional spreadsheet. For example, if you notice that the buildings in the tech sector are all growing taller and brighter, it might indicate a strong market trend in that area.
Rebalancing your portfolio becomes an intuitive process in this 3D environment. Instead of crunching numbers and adjusting percentages, you can simply rearrange the buildings to achieve your desired asset allocation. It’s like urban planning for your finances, where every move has a visual and immediate impact.
This approach to portfolio management is not just visually appealing; it also leverages the power of spatial reasoning. Our brains are wired to understand spatial relationships more easily than abstract data, which is why this holographic visualization can make complex financial concepts feel more accessible.
In industries beyond finance, similar technologies are already making waves. For example, in construction and architecture, holographic models are used to visualize and manipulate building designs. Researchers at the University of Florida have developed a system that imports building information models (BIMs) into gaming software to create interactive 3D holograms. This allows teams to collaborate more effectively and visualize the project from multiple angles, enhancing the design and planning process[1].
In the financial sector, companies like J.P. Morgan Asset Management are pioneering the use of augmented reality (AR) to engage clients and provide insights into complex economic data. Their Guide to the Markets in AR allows users to interact with 3D visualizations of market data and analysis, making it easier for financial professionals to communicate complex ideas to their clients[4].
The use of holographic displays is also becoming more prevalent, offering a more immersive experience than traditional 2D screens. These displays create three-dimensional images that can be viewed from different angles, providing a depth and realism that enhances understanding and engagement[2].
Euclideon’s Hologram Table is another innovative example, allowing multiple users to view and interact with 3D holograms simultaneously. This technology is particularly useful for industries like real estate and geospatial mapping, where non-technical stakeholders can easily visualize complex 3D models without needing specialized knowledge[5].
When it comes to financial planning, tools like Microsoft’s HoloLens are being used to visualize and interact with trading data in real-time. Traders can see dynamic 3D snapshots of market activity, analyze trends, and make data-driven decisions more efficiently. This technology reduces the need for multiple monitors and enhances the trader’s ability to monitor and analyze complex data streams[3].
In your own financial journey, adopting such immersive technologies can revolutionize how you manage your investments. It’s no longer about staring at screens filled with numbers; it’s about stepping into a living, breathing financial ecosystem where every decision feels tangible and intuitive.
As you navigate this 3D city, you start to see your investments not just as abstract numbers but as part of a larger, interconnected system. This perspective can help you make more informed decisions and stay ahead of market trends. It’s a new way of thinking about finance, one that combines the power of technology with the natural way our brains process spatial information.
In this world, spotting market trends feels like observing changes in a city’s landscape. You might notice a new development in the tech sector, represented by a cluster of rapidly growing buildings, or a decline in the energy sector, shown by buildings that are shrinking or changing color. These visual cues make it easier to react to market changes and adjust your portfolio accordingly.
The future of portfolio management is not just about data; it’s about experience. It’s about transforming the abstract into the tangible, and making complex financial decisions feel as natural as navigating a familiar city. With holographic technology, you’re not just managing your investments; you’re living them.


![Why Family-Controlled Companies Outperform: A Value Investor's Guide [2024 Analysis]](/images/585b62f3-7888-46c1-8896-556267cb9f33.webp)